
Understand app usage
For a product with app activity, the dashboard includes app metrics and cards. Use them to understand adoption after installation and whether people keep returning.
Start with the app metrics
- Installs counts install claims received during the period. A reinstall is another install.
- Active installs counts distinct installs that sent activity during the selected range.
- % on latest shows adoption of the latest configured app version.
- D7 retention shows how many eligible installs returned on day seven.
Select an app metric to explore its trend, just as you would a website metric.
Check version adoption
Find Version adoption in the app section. The card groups active installs by their latest reported version on the reference day and shows % on latest alongside the distribution.
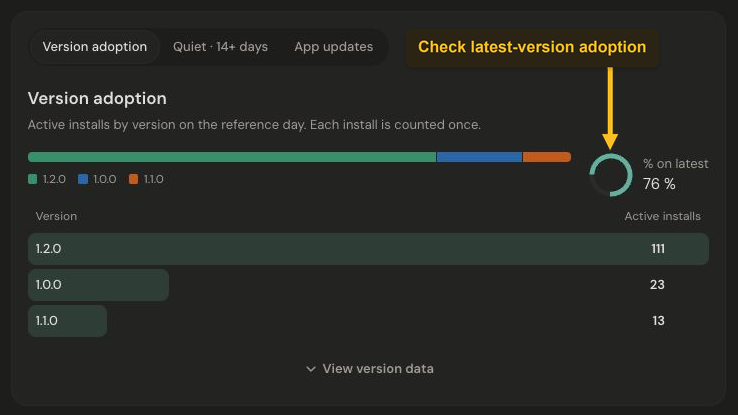
Version adoption shows each active install under its latest reported version. Select the image to view it at full size.
Use Quiet · 14+ days to explore installs that have stopped checking in, or App updates to inspect reported version changes. View version data opens the underlying breakdown.
Put retention in context
The Retention card offers D1, D7, and D30. A cohort needs time to reach the day being measured; recent installs may not yet qualify. Treat unavailable retention as unavailable, rather than assuming nobody returned.
Download to Install is a period ratio. Downloads and installs counted in the same period can belong to different people, so it is not a person-by-person conversion funnel.
Need to connect an app first? Choose the appropriate app setup guide, such as Electron or Tauri.